Research Projects
Summer 2007
Benjamin Holden: (Mentor – D. Patrick O’Neal)
Title: Encapsulated silica colloidal particles using
layer-by-layer electrostatic self-assembly of polyelectrolyte and fluorescent
dye
Introduction: Drug encapsulated particles in the size range of
100-200 nm are of significant interested because of there ability to target
tumors. It would be advantages to be able to use these particles’ imaging
properties to track the uptake in a tumor. Layer-by-layer self assembly can
be used to coat a wide variety of particles with polyelectrolytes, but most
fluorophore molecules have single charges and thus do not have a strong enough
charge to be effective coatings. However, if the dye is entrapped within polyelectrolytes,
it can form a complex that may be appropriate for coating in that the charge of
the polyelectrolyte overwhelms the opposite charge of the dye (Figure 1).
Methods: In the present study, two fluorescent dyes were used, ICG and NIR-664 with three interpolyelectrolyte complexes ICG-PDDA, ICG-Poly(ethyleneimine) (PEI), and ICG-Poly(allylamine hydrochloride) (PAH). A precursor layer of PDDA, alternated with PSS was coated by standard layer-by-layer methods (incubation of the particles with the polyelectrolytes, followed by two centrifugations and resuspensions in deionized water), and then dye+PDDA was alternated with PSS in additional coatings. Particle sizes were measured by dynamic light scattering (DLS), and the optical behavior of the particles was quantified by UV-Vis absorption spectroscopy and fluorometry.

Results: Figure 2 shows absorption spectra of ICG-PDDA, ICG-PEI, and ICG-PAH in 0.1 M sodium bicarbonate. Both the ICG-PDDA and the ICG-PAH have increased left peaks, indicating dye aggregation. ICG-PEI was the only interpolyelectrolyte solution that did not indicate dye aggregation. The ICG-PEI solution was used in a LbL assembly on a glass slide to determine if the dye-polyion solution could invert a substrate surface charge. As exhibited in Figure 3, a uniform increase in intensity was observed with increased dye layers.
 |
For particles in colloidal suspension, an absorption spectra was run on NIR-664 in three different polyelectrolytes PDDA, PEI, and PAH at a concentration of 1.5 mg/mL in DI H2O. NIR-664-PDDA was the only interpolyelectrolyte solution that did not indicate dye aggregation. A fluorescent emission scan was then run with NIR-664-PDDA (Figure 4). This result demonstrates that the particles have the desired fluorescent properties.
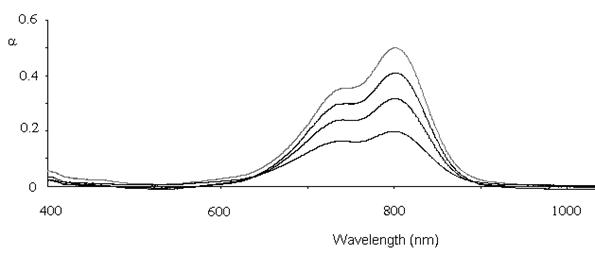 Figure 3: Absorption spectra from glass slide showing increased
absorption with increased number of dye-polyion layers. Curves from top to
bottom represent 5, 4, 3 and 2 layers.
Figure 3: Absorption spectra from glass slide showing increased
absorption with increased number of dye-polyion layers. Curves from top to
bottom represent 5, 4, 3 and 2 layers.
Figure 4:
Fluorescent intensity from
NIR-664-PDDA, demonstrating that the fluorescent intensity increases with
the number of layers added to the particles.
Conclusion: ICG can successfully be coated on a glass slide using the LbL technique however further work needed to be done on the fluorescent decay of ICG in solution. NIR-664 and ICG can be used in a dye-polyion solution. A single layer of dye coated on silica particles demonstrates fluorescent activity. However, particle aggregation has not yet been overcome in coating nano-sized particles with a fluorescent dye.
Venkata Damaraju: (Mentor – Sidney Sit)
Title: Effects of hydroxyapatite particle size on PAH-GMA hydrogels
Introduction: Hydrogel scaffolds have many potential uses from tissue engineering to drug delivery. The high water content and low interfacial tension of hydrogels tend to make them biocompatible. However, it is often difficult to encourage cell adhesion to these materials. In some cases, such as with polyethylene glycol diacrylate (PEG-DA), it is possible to incorporate adhesion peptides into the material. We propose that enhanced cell adhesion can be obtained if pores are introduced into the hydrogel by the addition of foreign particles. In the present study, hydroxyapatite particles were incorporated into a PEG-DA-based hydrogel to create pores in its cross-linking matrix. The surface structure and cross-sections of this hydrogel with hydroxyapatite particles embedded were examined through electrochemical impedance spectroscopy (EIS) and Scanning Electron Microscopy (SEM). Like other PEG-DA based scaffolds, this hydrogel has potential to be used for drug deliveries or possibly cornea implants.
Methods: A PAH-GMA monomer cross-linked with PEG-DA was used to form a new kind of hydrogel which could potentially be used as a cornea replacement in the human eye. Hydroxyapatite particles of micro and nano sizes were added to the hydrogel. These particles were sonicated in the hydrogel for various times and examined using EIS and SEM. Glycidyl methacrylate Methacrylsaure-glycidylester (GMA) was added to Poly (allylamine hydrochloride) (PAH) in dissolved in distilled water, and acetone was added slowly to obtain the PAH-GMA macromer. PEG-DA solution and Irgacure solution were then added to the PAH-GMA macromer and stirred well. Then the mixture was transferred into a quartz beaker and divided into different test samples with various sizes of hydroxyapatite particles. Each of these samples was then subjected to UV irradiation until the solution solidified completely.
Results: EIS revealed that the overall impedance dropped for the hydrogel with particles and SEM confirmed that the particles were distributed in the hydrogel (Figure 5). However, random clumps of material were also visible in the SEM, which could have resulted from sonication and polymerization. Both micro and nano sized particles reduced impedance, measured by EIS, in the same manner (Figure 6). In addition, the micro particles became broken down into much smaller structures.
 |
Figure 5: SEM images of the hydrogel without (left) and with (right) added microparticles.
Danielle Lewis: (Mentor – David K. Mills)
Title: Characterizing TMJ Disc Cells Grown in Collagen and Agarose Gel Culture
Introduction: Disorders involving the temporomandibular joint disk affect nearly 10 million people in the United States (Allen and Athanasiou, 2006). In individuals with TMJ disorders the action of opening and closing jaw becomes painful because the disc's location disrupts the normal jaw motion, known as disk displacement. One possible therapy is to replace the disk with a tissue engineered substitute. To reach that goal, it would be necessary to have the cells produce collagen type I and proteoglycans, and expression of these products depends on the cellular environment. Recently electrospinning has been used to construct polymer scaffolds in the hopes that they will provide a promising basis for engineering a new TMJ disc. Electrospinning results in a nano-scale fibrous mesh that serves as a good 3-D scaffold because of its high porosity and large surface-to-volume ratio (Figure 7).
To investigate the potential of electrospun scaffolds in encouraging protein expression, experiments were carried out to characterize the extra-cellular matrix produced by fibrochondrocytes in 2 different types of gel scaffolds, agarose and collagen. It is hypothesized that the cellular matrix produced by fibrochondrocytes grown on electrospun PCL scaffolds will most resemble the cellular matrix found in an actual TMJ disc as compared to the extra-cellular matrix produced in either an agarose or collagen scaffold.
 |
Figure 7: (Left) Device used for creating electrospun nanoscaffolds. (Right) Product of the electrospinning device.
Methods: Fibrochondrocytes were extracted from bovine TMJ discs by digesting the tissues with trypsin and collagenase I, liberating the associated cells. The cells collected from the digestion process were passaged 6 times in tissue culture dishes before seeding onto either agarose or collagen gel scaffolds. Cells were seeded at a concentration of approximately 250,000 cells per mL. A Coulter counter was used to determine the concentration prior to seeding. The fibrochondrocytes were cultured in both agarose and collagen gels for a period of approximately 10 days, the gels were fixed and imbedded in paraffin wax. The media was reserved for possible Elisa analysis. The gels were dehydrated by placing them in a series of alcohols and histoclear solutions, and then infiltrated with paraffin for preservation purposes. The gels were then imbedded in blocks of paraffin. The blocks of paraffin were sliced using a microtome and the slices mounted on slides in preparation for immunohistochemistry.
Results: Unfortunately time constraints did not allow for the staining process to begin but differences between fibrochondrocytes cultured in the 2 different gel environments was evident. Throughout the entire culture period the progress was monitored every several days using phase contrast microscopy. Using an inverted microscope at a magnification of 10X it was evident that the bovine fibrochondrocytes preferred the collagen gel environment over the agarose environment.
In the collagen gels the fibrochondrocytes attached to the gel scaffold within a day or two, taking on the characteristic fibrochondrocyte shape. The cells changed from small bubble like structures to a more elongated, sickle like shape. This elongated shape resembled the appearance of fibrochondrocytes cultured in tissue culture plates. While the fibrochondrocytes placed into the agarose gel environment never exhibited this characteristic structure. Throughout the entire culture period the cells grown in the agarose maintained the same shape, small bubble like spheres. This shape did not resemble the characteristic, sickle shape of healthy fibrochondrocytes. In contrast these cells remained unattached, instead most resembling the shape of fibrochondrocytes that have been lifted from a tissue culture plate using trypsin in preparation for passage.
Conclusion: Direct observations indicated that bovine fibrochondrocytes prefer to grow in a collagen gel environment rather than an agarose gel environment.
David Huang: (Mentor – Frank Ji)
Title: Porosity Response of Layer-by-Layer Nanocapsules on the Basis of Ultraviolet Light
Introduction: Whereas drugs can be effective in treating diseases such as cancer, traditional methods of drug delivery allow the drug to penetrate systemically to all regions of the body. For localized targets, it is more effective and less harmful to the patient if the drug is delivered directly to the region of interest, such as a tumor. One method of concentrating a drug locally is to administer the drug in a nanocapsule and then apply some type of energy or other stimulus externally at the target area. It is proposed in this study that ultraviolet light can act as a trigger that will increase porosity of a nanocapsule and cause the drug to be delivered only in the local area in which it is needed.
The light energy must energize the polymer within the nanocapsule, changing its structure. The extra energy would allow the bonds in the polymer to change from cis bonds to trans and remaining stable. This in turn should increase the porosity of the nanocapsule allowing the diffusion of the drug within out to its surroundings with ease. Nanocapsules were produced using a layer-by-layer technique of PHES polymers around a colloidal silica particle. The particles were exposed to ultraviolet light (355 nm), and the nanocapsules were filled with a fluorescein dye in place of actual drugs. This dye gives off a fluorescent intensity that can be measured.
Methods: The nanocapsules were prepared using the layer-by-layer (LbL) electrostatic self assembly technique, and the polymer, Poly (1- (4 – (3 – carboxy – 4 – hydroxyphenyloazo) benzenesulfonamido) – 1,2 – ethanediyl, sodium salt) (PHES) is coated onto a colloidal silica nanoparticles, followed by poly(ethyleneimine) (PEI). The silica cores were dissolved with 0.01 M hydrofluoric acid, and the particles were washed by centrifugation in deionized water. The nanoparticles were submerged in a 0.001 M fluorescein dye for 24 hours to incorporate the fluorescent dye into the particles. The particles were submerged in 1 ml of water, and the supernatant was monitored by fluorescent spectroscopy, with an emission wavelength of 512 nm and an excitation of 444 nm.
Results: Whereas the supernatant demonstrated an increased amount of fluorescent dye immediately after the particles were placed into the water (most likely as a result of dye adsorbed onto the surface of the particles) the particles that were exposed to ultraviolet light maintained a continued high rate of increase in fluorescence after the initial burst (Figure 8). The amount of dye released from the inside of the dye is indicated by the rate of increase of fluorescence beyond the initial value. After about 15 seconds, the fluorescent intensity decreases as a result of dye consumption. However, during the initial release time the rate of release is greater for the cases in which the particles are exposed to ultraviolet light.
Figure 8: (Left) Change in fluorescent intensity with time with and without ultraviolet light. The dye in the supernatant initially increases to a peak until the rate of dye consumption is greater than the rate of dye release. Dye is released more rapidly for the case with ultraviolet light. (Right) Expanded view of the data in the left hand plot for small times. Slopes of the linear regressions indicate the rates of dye release.
Conclusion: The nanocapsules responded to ultraviolet light, and the porosity of the nanocapsules affected the rate of diffusion of a substance from within the capsule out to its surroundings. The diffusion rate increased as much as three times the value for the control case. The method is therefore promising as an approach to improving the efficiency of drug delivery techniques.
Kristan Moore: (Mentor – Tabbetha Dobbins)
Title: Layer by layer nanoarchitectures assembled from alumina (Al2O3) systems
Introduction: In the production of hydrogen fuel cells, there is a need to control the structure of groups of nanoparticles. The goal of this work is to produce triple-point boundaries, which enhance the transport of ions and oxygen in the fuel cells. It is proposed that the layer-by-layer technique can coat micro-particles with controlled nano-particles, thus stabilizing their boundaries and altering their behavior in both colloidal suspensions and planar surfaces. The present study was carried out to determine extent to which this process can be controlled by varying concentrations of polyelectrolyte and the deposition times.
Methods: The layer by layer assembly method was used with polyallyamine hydrochloride (PAH), polystyrene sulfonate (PSS) and polyethyleneimide (PEI) on microscale and nanoscale Al2O3 and on nanoscale ZrO2. The successful coating of materials with polyelectrolytes was verified by quartz crystal microbalance. Energy-dispersive x-ray spectroscopy (EDS) was used to differentiate between the results of the different cases, and morphology was examined by scanning electron microscopy.
Results: The layer by layer self-assembly approach successfully deposited the multilayers and allowed the morphology to be controlled (Figure 9). A planar geometry was produced with a top Al2O3 layer of 0.7 mm, a middle ZrO2 layer of 0.5 mm, and a bottom Al2O3 layer of 0.6 mm. Deposition on the planar surface was confirmed by SEM and EDS (Figure 10). However, the method of attaching the nm-size particles to mm-sized colloidal particles was not as effective with Al2O3 particles as it was with latex particles (Figure 11).
Discussion: Future experiments will include optimizing the working pH to provide maximum density in the Al2O3 and ZrO2 layers. Future work will improve the layer-by-layer parameters to better attach the nm-size particles to the mm-size particles.
Conclusion: Because the planar geometry was successful, the approach should be usable for colloidal particles, but changes in the layering technique and protocols will be needed.
Bottom (nm-Al2O3) Middle (nm-ZrO2) Top (nm-Al2O3)
![]()
![]()
![]()
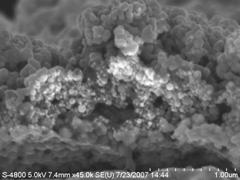
Figure 11: SEM images of nanoparticles on latex (left) and on Al2O3. The nanoparticle coatings are clearly visible for the latex microparticles, but not apparent for the Al2O3 particles.
Gregory Smith: (Mentor – Sven Eklund)
Title: Optimizing the Film Matrix for a Fluorescence Based Oxygen Sensor Using Pt(II) Octaethylporphine
Introduction: Micromanufactured devices for cell culture and analysis require various sensors to monitor the responses of the cells. The sensing of oxygen is particularly important because it is required by all cells and is involved in a large number of biochemical reactions. One method for detecting oxygen uses fluorescent films whose optical properties are altered by oxygen, such as by oxygen quenching. In this study, various methods for creating a film matrix to be used in a fluorescence-based oxygen sensor were tested in attempts to optimize the desired characteristics of the film matrix.
Methods: The film was created on a glass slide that is placed over a micro-channel in which the oxygen content would be measured. The fluorescent dyes Pt(II) octaethylporphine (PtOEP), rhodamine B, and rhodamine B isothiocyanate (RITC) were examined. PtOEP is quenched by oxygen, while rhotamine B and RITC are insensitive to oxygen. Comparison of the oxygen-sensitive and oxygen-insensitive signals allows a quantitative measure of the amount of oxygen. PtOEP was incorporated into the system by one of three methods (1) adding it directly to the solution in the microchannel, (2) coating the slide with alginate-silica microspheres containing PtOEP, and (3) adding the PtOEP microspheres directly to the solution.
The film matrix was created in each of the following ways: (1) to create a silica glass film by using a silicon alkoxides, tetraethoxysilane (TEOS), methyltrieth-oxysilane (MTEOS), ethyltriethoxysilane (ETEOS), or phenyltriethoxysilane (PTEOS), (2) to form a hydrogel from poly(ethylene glycol) diacrylate (PEG-DA), to entrap the PtOEP into a film made from one of several adhesives, (4) to create a polydimethylsiloxane (PDMS) matrix, (5) to place the PtOEP into various solvents and spot it onto the glass slides.
The various film matrices were tested first in solution to see if any fluorescence was present. Nitrogen gas was then bubbled into the solutions in order confirm that the PtOEP was responding to the reduced oxygen level. The film matrix was then spotted onto a glass slide and allowed to dry. The films were then tested under nitrogen gas flow and deoxygenated water flow and the intensity of their fluorescence was measured with a spectrometer.
Results: Figure 12 shows the fluorescent intensity as a function of time for three of the configurations tested.
In all cases the fluorescent intensity increased when nitrogen was introduced into the channel. Most of the films gave no signal under water flow with the exception of the E-6000® films. The larger the spots were the more likely to crack, so the best spots were the ones spotted using an open micropipette tip. Thicker films gave a more intense signal but were more likely to crack or flake off of the slides. The fluorescent intensity changes almost immediately in response to the change in oxygen content. When allowed to reoxygenate the response was slower unless air or regular water was pumped into the flow chamber, meaning that the response was from the flow and not from oxygen leaking into the flow chamber.
For TEOS films, the microspheres tended to give a more intense signal then the plain PtOEP. The PEG-DA hydrogel showed some response while in solution but once it was spotted on none at the PtOEP peak after it being spotted onto the slide. In addition, the hydrogel films were either not drying or did not adhere to the glass slide and washed off under flow. The PDMS gave good signal response under air flow but no signal under water flow. PDMS also did not dry well and would not adhere strongly enough to the slide, causing it to wash away under water flow in the chamber.
The E-6000® gave the best response to both air and water flow through the flow chamber, compared to the other film matrices. It was also easy to shape and flatten before it dried. Since PtOEP dissolved into the E-6000® so easily and in such a high concentration there was no need to use the microspheres to boost the fluorescent intensity making it even easier to work with. However, the fluorescent intensity of the E-6000® film steadily declined with time (Figure 13).
Conclusions: The best results were obtained when the concentration of PtOEP was as high as possible. RITC was a better reference dye than rhodamine B because it’s emission peak overlapped less with PtOEP. The E-6000® is close to the ideal film matrix, it has all of the desired physical properties and it gives good signal response to oxygen changes in water. However, it suffered from a steady decline in signal intensity over time. The cause of the decline needs to be determined and prevented. A different adhesive similar in chemical structure to E-6000® may be needed to stabilize that decline.
Joy Walker: (Mentor – Yuri Lvov)
Title: Fruit as Template for Electrostatic Layer by Layer
Introduction: The food industry is looking for new strategies to coat fruits to increase storability, shelf-life and microbial safety. The integration of proteins, polysaccharides, and or lipids together may give the coatings desired properties, but edible coatings must be sufficiently minimal to prevent them for affecting the taste of the food.
Electrostatic layer by layer self assembly is a technique that coats surfaces. It uses to oppositely charged polymers and coats about a nanometer per layer. This may enable the use of bilayers that are of a different nature and a precise thickness in coatings. In addition, the use of the charges can be used to repel microbes. A negative outer layer may repel the negative microorganism and/or the layers would make it harder for the microorganisms to penetrate the surface of the fruit. In the present study, clay and the biocompatible polymers carboxymethyl cellulose (CMC) and protamine sulfate (PS) will be used to form layers on grapes, cherries and tomatoes.
Methods: Coatings were generated by alternating layers of cationic carboxymethyl cellulose (CMC) with anionic protamine sulfate (PS). Coating thicknesses were measured with a quartz crystal microbalance. The skins of the fruits were examined by a zeta potentiometer and by confocal microscopy. The fruits were also allowed to stand in a ambient conditions and in a dark, humid location, and the weight of each fruit was measured as an indicator of water loss. The cherries were placed in contact with bacteria (Aspergillus Niger) and examined over time to determine whether the layering inhibited the rate of decay.
Results: Quartz crystal microbalance studies demonstrated that the thickness of the polymeric layer was approximately 35 nm after 13 layers. The zeta potential for the grape skin was -39.86 with a standard error of 2.35. The zeta potential of the layered grape skin was inconclusive, probably because the slices were not thin enough. The layered grape seemed to lose water more slowly than the control. However, the amount of water loss increased with an increase in the number of bilayers, under both ambient and dark, humid conditions. In contrast to the expected result with respect to decay, all layered cherries that were placed in contact with bacteria decayed more rapidly than the unlayered controls in the same environment.
One problem observed from the confocal microscopy was the apparent accumulation of polyions in the cells of the skin (Figure 14).
Figure 14: Confocal microscopy images of the tomato skin, illustrating pores that appear to be filled with polyions (white arrow).
Conclusions: The ability of layer-by-layer to help preserve fruit was not confirmed by these studies. It is speculated that the process may wash away some of the natural components in the skin that protect the fruit, and this possibility must be investigated further. In addition, other types of polyions may be more useful in achieving the objective.
Jeff Fontenot: (Mentor – Steven A. Jones)
Title: The Effect of Shear Rate and L-Arginine on Platelet Activation and Adhesion
Introduction: Platelets form thrombi in the blood through a positive feedback mechanism in which an activated platelet releases substances, such as adenosine diphosphate (ADP), serotonin and thromboxane A2, that activate other platelets. If this process were not modulated by an additional negative feedback system, then it would lead to a completely thrombosed blood system. However, the negative feedback mechanisms of the system are not well understood. An important signaler of platelet inhibition is nitric oxide (NO), which depends on the precursor L-arginine for production. An important initiator of platelet activation is shear stress.
Previous work by Eshaq, demonstrated that platelet adhesion under flow conditions to a fibrinogen-coated surface in a microchannel decreased with increasing L-arginine concentration, as expected. However, previous studies by Frilot had demonstrated no change in surface coverage, serotonin release or number of thrombi under static conditions for a Petri dish coated with collagen type I. The contrast in these two studies led to the hypothesis that the effect of L-arginine, and hence NO, is stronger under flow conditions than under static conditions. Therefore, the present study was designed to examine the effect of L-arginine on platelet adhesion under different shear rates.
Methods: Platelet-rich plasma (PRP) was extracted from bovine blood and divided into two samples. One sample had no added L-arginine, and the other had L-arginine added to create a 20 mM/L concentration. Portions of each sample were injected through different microchannels that were coated with fibrinogen through the layer-by-layer self assembly process. Different flow rates were used, corresponding to different shear stresses (1, 5, 7 and 16 dynes/cm2) and flow rates (1.9, 9.7, 13.6 and 29.2 mL/hr). The platelets that adhered to the bottom of the microchannel were tagged with acridine orange (which tags RNA in the platelets) and examined under a fluorescent microscope. Platelet adhesion was quantified as the percentage of surface on the bottom of the channel that emitted a given threshold intensity of fluorescent light.
Results: Figure 15 shows the results of the study. These results were contrary to the initial hypothesis in that the case with L-arginine appeared to have no observable trend with shear stress, while the case without L-arginine appeared to demonstrate a decrease in adhesion with increased shear stress. In addition, the cases with L-arginine had a greater amount of surface coverage, rather than the expected reduction in surface coverage.
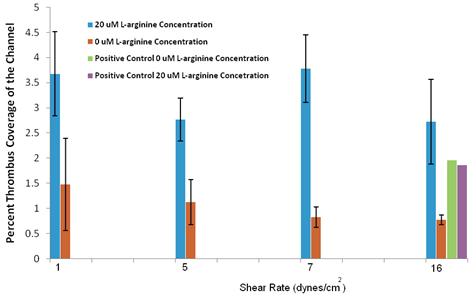
Figure 15: Percent thrombus coverage as a function of flow rate for the different cases with and without L-arginine.
Discussion: This study, while inconclusive, exhibited some of the possible problems that may arise in these experiments. It is suspected that the amount of time after the PRP has been extracted by centrifugation can strongly affect the amount of adhesion, and with one syringe pump the amount of time required to run all of the channels can be on the order of hours. As a result of these studies, the lab has invested in a new 10-syringe pump so that all of the channels can be run simultaneously. Also, more attention needs to be paid to the signal processing method. A visual inspection under the fluorescent microscope indicated that the cases with L-arginine had less adhesion than the cases without L-arginine, but the data analysis gave the opposite result. One needs to investigate whether the initial impression obtained from looking into the microscope was in error or whether there is a step in the image processing that causes the adhesion images to be misinterpreted.
Conclusions: The studies need to be re-run, with the changes suggested in the Discussion section.
Summer 2008
Peter Venema: (Mentors – Scott Gold & Sven Eklund)
Title: Application of P3HT in Supercapacitors
 Introduction: Supercapacitors
are capacitors with high capacitance and fast charge times, and they have
multiple applications as energy storage devices and power supplies. They have
substantially larger surface areas and smaller gap distances than standard
capacitors. The compound Poly-3-(hexylthiophene-2,5-diyl) (P3HT)
has been used in transistors, mostly for its redox reaction property, but has
not been examined for use in supercapacitors. We therefore have examined the
properties of this material when applied as a supercapacitor.
Introduction: Supercapacitors
are capacitors with high capacitance and fast charge times, and they have
multiple applications as energy storage devices and power supplies. They have
substantially larger surface areas and smaller gap distances than standard
capacitors. The compound Poly-3-(hexylthiophene-2,5-diyl) (P3HT)
has been used in transistors, mostly for its redox reaction property, but has
not been examined for use in supercapacitors. We therefore have examined the
properties of this material when applied as a supercapacitor.
Methods: The capacitance of the material was examined by cyclic voltammetry, the charge was measured with chronopotentiometry, and the impedance was measured with potentiostatic impedance spectroscopy. The experimental setup is shown in Figure 1.
Results: Cyclic voltammetry results are shown in Figure 2 for various extraction methods (SA-UNF, SA-DC, and SA-THF) and two nanotube sizes (100 and 200 nm). The material acts as a capacitor if the capacitance is constant. The curves demonstrate only small differences between the different extraction methods.
Figure 2: Cyclic voltammetry results for 200 nm (left) and 100 nm carbon nanotubes. The devices demonstrate capacitive behavior when the slopes of the curves are near zero, (e.g. near 1 V and -0.5 V in the right-hand figure).
Chronopotentiometry demonstrated a maximum useful voltage for these devices of 1.6 volts. Potentiostatic impedance spectroscopy demonstrated that the devices’ impedance was strongly capacitive.
Conclusions: P3HT shows promise as a supercapacitor material. The extraction methods do not appear to affect electrical behavior of samples, and the nanotube diameter does not appear to significantly affect capacitive behavior.
Kristan Moore: (Mentor – Tabbetha Dobbins)
Title: The Preparation of Intermediate Temperature Solid Oxide Fuel Cells Using Layer by Layer Self Assembly
Introduction: Solid, oxide fuel cells (SOFCs) produce electricity by directly oxidizing fuel. SOFCs differ from ordinary fuel cells in that they contain four layers, three of which are a porous cathode, a dense electrolyte, and a porous anode. The cathode and anode material in an SOFC must be electronically conductive. Lanthanum strontium manganite (LSM) is the prime choice for a cathode material because it is highly compatible with yttrium-stabilized zirconia (YSZ), a popular ceramic material (cermat) that is used for the anode and electrolyte layer. Cathodes consisting of LSM/YSZ have been used as a method of increasing the triple phase boundaries found in SOFCs. The anode layer of an SOFC is porous because it must allow the fuel flow to reach the electrolyte. The anode must also be able to conduct electrically and ionically. Because the anode is typically the strongest and thickest layer in a SOFC and provides most of the mechanical support, it has the smallest polarization loss of all the layers. SOFCs are applicable in many areas from serving as an auxiliary unit of power in vehicles to a stationary unit of power generation. As a stationary generator of power, the outputs range from 100 watts to 2 megawatts. Typically, a single SOFC can function between 600-1000 °C and can perform at an efficiency level of 60%. However, this level of efficiency can be increased to 85% if the byproduct gases used are able to fire a secondary gas turbine. It has been suggested that appropriate anodes can be made from a Nickel-ZrO2 cermat that has been coated, through layer-by-layer self assembly, with Ni, but earlier experiments demonstrated that the Ni would not remain in solution for layering. The objective of this study was therefore to examine the possible mechanism of this problem.
Methods: A 50 vol % Ni and 50 vol % ZrO2 cermat was pressed using a Carver Press at ~3.5 tons or ~35,000 psi. The pellet was then heat treated or sintered using the Vulcan Box Furnace Model 3-130 at 1050 °C (10 °C/minute) for five hours with cooling dimensions at 10 °C/minute. SEM measurements were conducted on a ¼ of the raw pellet. The pellet was cut into quarters using the Buehler low speed diamond saw and ground and polished. Self-assembly was performed with Ni and PSS, after which the sintered body was repolished, heat treated once more for 10 hours, and then polished again with 6 mm and 1 mm diamond paste. The procedure was repeated on another pellet, except that the self-assembly was performed with Ni and PEI, and was repeated for solution pH values of 3, 4, 5 and 6.
Results: At pHs 3, 4, and 6, Ni particles continued to fall out of suspension, but at pH 5, the Ni particles remained in suspension for an extended period of time. Self assembly was then performed to construct the anode layer, but SEM (Scanning Electron Microscope) measurements revealed that the Ni particles were not producing a substantial amount of deposition or growth. While we were unable to accomplish the formation of the anode layer with just layer by layer self assembly, we were able to simply construct our anode layer from a pressed and sintered (heat treated) pellet that was 50 volume % Ni + 50 volume % ZrO2. From this pellet we were attempted to self assemble the electrolyte layer consisting of ZrO2 and the polyelectrolyte PSS (polystyrene sulfonate). These results are shown in Figure 3.
Figure 3: Electrolyte layer consisting of ZrO2 and PSS.
It was believed that the particles in the image after sintering are the deposited ZrO2 particles, but better polishing of the raw pellet was needed before we could compare images of the pellet before deposition (raw) and after deposition (after sintering). After obtaining these results, we attempted to construct the anode layer using ZrO2 and the polyelectrolyte PEI (polyethyleneimine). The results of this step are shown in Figure 4.
Figure 4: Electrolyte layer consisting of ZrO2 and PEI.
The image of the raw ZrO2 particles (inset), suggests that the spherical particles shown in the SEM images before sintering and after sintering are the ZrO2 particles, indicating that deposition of the electrolyte layer did occur. However, the electrolyte layer was not as dense as desired. We suspect that this problem can be solved with simply the deposition of more ZrO2 layers. The flat regions that are shown in Figure 4 indicate that the pellet underwent a better polishing this time. Results from EDS (Energy Dispersive X-Ray Spectroscopy) detected both Ni and ZrO2. However, it is not clear whether that signature was from the surface of the pellet or deep within the pellet itself.
Conclusion: It will be necessary to alter the layering parameters if this process is to be used.
Brittaney Mauer: (Mentor – D. Patrick O’Neal)
Title: Cancer targeting by liposomal encapsulation of an anticarcinogen.
Introduction: Cancer has become an ever-increasing contributor to death around the world. During 2005 the second leading cause of death in the United States, following heart disease, was due to malignant neoplasms (cancer), seizing more than 500,000 lives in that year alone (Kung). The immense effect this has on the lifestyle of individuals experiencing such inflictions necessitates advancement in anticarcinogenic research and technology. While various options are available for treatment, such as chemotherapy and radiation, these have severe side effects and can accelerate a patient’s death. For chemotherapy, there is a need for a less global treatment, in which cancerous cells are directly targeted and healthy cells are avoided by the treatment. One method that has been suggested is the encapsulation of an anticarcinogenic substance in a targeted nanoshell.
Although there are anticarcinogenic substances available and used in practice, many of them must be improved upon in order to become more effective. It has been found that once many of these substances enter the body, the reticuloendothelial system (RES), commonly referred to as the body’s immune system, acts quickly to remove the foreign material. Two anti-carcinogens were considered during this research, a virus and EGCG. Therefore the current research is designed to test the hypothesis that a virus or EGCG encapsulated within a liposome will target a tumor more effectively than an anticarcinogen which lacks a nanocarrier by releasing the virus or EGCG directly to the tumor, which will then attack tumor cells with minimal effects experienced by other cells within the body.
Methods: The lipids and cholesterol were placed in a round-bottom glass test tube and were dissolved in 1mL chloroform. The chloroform was then evaporated from the solution by running a nitrogen stream over it. The lipid cake was then stored in a freezer at -20°C for one hour, or until completely frozen. The lipid cake was then transferred to a lypholizer for a minimum of four hours. When the sample was finished lypholizing, it was hydrated in 20mM HEPES buffer saline (HBS) at pH 8.0 that had been pre-heated to 80°C. The new solution was shaken vigorously for half an hour and allowed to hydrate overnight. The following morning the liposomes were sonicated for a half hour with intervals of 10 minutes ON, 5 minutes OFF. They were checked on a dynamic light scattering (DLS) device and then sonicated for 15 more minutes to get the size down to 100-150nm in diameter.
Liposomes made with DSPE-PEG2000 were created by mixing DSPC:Chol:DSPE:DSPE-PEG2000 at a ratio of 50:40:5:5. The liposomes were labeled with 4,5-Benzo-1'-ethyl-3,3,3',3'-tetramethyl-1-(4-sulfobutyl)indodicarbocyanin-5'-acetic acid N-succinimidyl ester, otherwise known as NIR-664. Two methods were used for this process using DSPC:Chol:DSPE.
When DSPE-PEG2000 was used, dye was either added to DSPE before the lipids were mixed (as described previously) or was added during the hydration of the lipid cake.
The ABTS Assay was used to detect the amount of EGCG present in a given sample. This colorimetric assay shows an inversely proportional relationship between the absorbance and the amount of EGCG present in solution (i.e. less absorbance correlates with more EGCG). A UV/VIS spectrophotometer was used to read the absorbance of each sample.
To measure the release of EGCG from nanoparticles, they were placed inside a dialysis cassette. At various time steps a sample was taken directly from the solution within the membrane of the dialysis cassette. In a dark room, 2mL of ABTS solution diluted to an absorbance of 1.4 was added to each cuvette. A UV/VIS Spectrophotometer was used to take a reading of each sample. If the sample in the membrane showed the same absorbance as the last sample taken from the dialysate, then equilibrium was reached.
Results: DSPC:Chol:DSPE at a ratio of 50:45:5 provided reproducible liposome production. To dye-label liposomes made in this way, one can either dye DSPE (one of the lipids) before making the lipid cake or dye the liposomes after they have been hydrated. As seen in Tables 1 and 2, both methods are successful. In order to obtain the proper size of less than 200nm, it is necessary to either sonicate the hydrated lipids for approximately 45 minutes, or to centrifuge them for 10 minutes at 20,000g.
Table 1: Size of liposomes composed of DSPC:Chol:DSPE at a ratio of 50:45:5, manufactured on 6/11/2008. Prior to these size readings, sonication was performed for 40 minutes on the entire batch of multilammelar vesicles. These data were collected using Dr. Dobbins’s DLS system.
|
Radius (nm) |
Diameter (nm) |
Percent (%) |
|
After with dye-labeling NIR-664, collected on 6/19/2008 |
||
|
47.8 |
95.6 |
52 |
|
56.5 |
113 |
63 |
|
55.3 |
110.6 |
69 |
|
57.2 |
114.4 |
68 |
|
Average: |
108.65 |
63 |
|
After with dye-labeling NIR-664, centrifuged 10 minutes at 20,000g, collected on 6/24/2008 |
||
|
0.13 |
0.26 |
94 |
|
47.8 |
95.6 |
54 |
|
51.4 |
102.8 |
38 |
|
49.4 |
98.8 |
42 |
|
Average: (excluding trial 1) |
99.067 |
44.67 |
Table 2: Size of liposomes composed of DSPC:Chol:DSPE at a ratio of 50:45:5, manufactured on 6/24/2008. Before the lipid cake was formed, DSPE was dyed with NIR-664. The sample was centrifuged for 20 minutes at 20,000g and the supernatant was removed. These data were taken on Dr. Dobbins’s DLS system on 6/27/2008.
|
Radius (nm) |
Diameter (nm) |
Percent (%) |
|
6440 |
12880 |
60 (outlier) |
|
47.8 |
95.6 |
41 |
|
53.4 |
106.8 |
29 |
|
55.6 |
111.2 |
41 |
|
Average: (excluding trial 1) |
104.53 |
42.75 |
In attempting to PEGylate the dyed liposomes created by DSPC:Chol:DSPE at a ratio of 50:45:5, large particles formed showing an unsuccessful means of PEGylation. This led to the use of DSPE-PEG2000, which circumvents the PEGylation process altogether.
DSPE-PEG2000 was used in the same fashion as the previous method, but the liposome composition was modified to DSPC:Chol:DSPE:DSPE-PEG2000 at a ratio of 50:40:5:5. This makeup successfully established PEGylated liposomes under 200nm.
Dye-labeling the liposomes manufactured with PEG-conjugated DSPE produced blue clumps of particles. Adding dye during hydration was also attempted, but produced the same results. By syringe-filtering the sample with a 450nm cutoff syringe filter, the remaining sample had an average of 77% of the particles at a size of 138.95nm in diameter. These data are promising because they show that it is possible to create a dye-labeled, PEGylated liposome below 200nm in diameter. A possible reason for the precipitate is that NIR-664 is not soluble in water, which is used in the HEPES buffer throughout the experiment. The sample which still contained the precipitate was then added to 10% DMSO. After sitting overnight, the large particles had returned to solution. This finding strongly suggests that the reason the particles formed was the insolubility of NIR-664 in water. A dye that is water soluble, such as indocyanine green, should work more effectively, not producing a precipitate.
Conclusions: The method of passively targeting a tumor with an anti-carcinogen encapsulated by a liposome continues to be a promising means of cancer therapy. Although the research reviewed by this paper does not encompass the encapsulation of such a substance, it did define a liposome manufacturing protocol that creates a small yield of dye-labeled, PEGylated liposomes below 200nm in diameter on which in vivo testing could be conducted.
Rachel Gade: (Mentor – Henry Cardenas)
Title: Electrochemical particle treatment of bone will increase the strength and stiffness of the bone.
Introduction: Brittle bones can be a significant problem for various
populations, including people with osteoporosis and brittle bone disease. In
addition, the ability to strengthen bone could be valuable for space travel and
for the repair of broken bones. A technique that is under investigation for
civil engineering applications of concrete uses nanoparticles that are injected
into the concrete and then moved through the material with an electric
current. The same procedure could be applied to bone. We therefore tested the
hypothesis that this procedure, when applied to bone, would increase the
elastic modulus.
Methods: Bones that had been harvested were injected with Tricalcium Carbonate nanoparticles and then subjected to a 0.1 mA electrical current over a period of hours. After this preparation, they were tested with the three-point bending test to determine the elastic modulus.
Results: Bones that were treated with these nanoparticles were found to have elastic moduli approximately 50% higher than untreated bones. Although it was not possible to obtain enough samples to perform statistical testing, these results indicate that the method could be advantageous.
Conclusion: These studies verified that the strengthening effect may apply to bone, and have convinced the group that it is worth the investment to perform a more extensive set of controlled experiments.
Laura Place: (Mentor – Sidney Sit)
Title: Effect of direct current on fibrochondrocytes in a chitosan scaffold
Introduction: Once damaged, cartilage has restricted renewal capabilities. Cartilage has a low cell proliferation rate and is avascular; meaning there is no transport system to carry regenerative cells to the damaged site. Current treatment methods for bone regeneration include the use of bone grafts, either autologous or from a donor, osteosynthesis, bone-substituting biomaterials, and growth factors. Autologous bone grafts are preferred over donors in order to avoid donor shortages, negative immune responses, and pathogen transmission. However this method has its own complications. There is a high risk for donor site morbidity and only small volumes can be removed from the donor site. The other three methods can treat small defects, but once they are critically sized these treatments fall short. Tissue engineering holds much promise for finding a solution to this predicament.
A number of materials can be used to construct tissue culture scaffolds, including bioactive ceramics, synthetic polymers such as poly(glycolic acid) (PGA), poly(L-lactic acid) (PLLA), and poly(DL-lactic-co-glycolic acid) (PLGA), and natural polymers such as chitosan. The ceramics chemically resemble natural bone, promote osteogenesis, and can bind with host bone, but are brittle and degrade too slowly. The synthetics polymers have appropriate mechanical properties and degradation rates, but do not exhibit sufficient cell adhesion and are hydrophobic which inhibits cell proliferation, and are devoid of available functional groups for surface modification. Chitosan is a cationic polymer derived from partially depolymerized and deacetylized chitin found in crustacean shells. [9] It is biologically renewable, biodegradable, biocompatible, non-antigenic, non-toxic, and biofunctional. In addition, chitosan is hydrophilic and facilitates cell adhesion, proliferation, and differentiation. It causes minimal immune responses and is osteoconductive Chitosan’s cationic properties allow it to bind glycosaminoglycans (GAGs). This allows the scaffold to retain growth factors excreted by cells growing on the scaffold, promoting cell growth and differentiation. It is possible to control chitosan’s degradation rate by regulating the degree of deacetylation. Some forms have been found to last several months in vivo. Chitosan scaffolds can be produced in any desired shape and have an excellent ability to form porous structures. In addition, chitosan is intrinsically antibacterial. These properties make chitosan ideal for use as a scaffold in tissue engineering.
Electrical stimulation has been used incite closure of skin ulcers and promote bone fracture healing. It has demonstrated increased healing of epidermal wounds, nerve axon re-growth, repair of articular cartilage, and osteogenesis. The application of an electrical field may enhance cell proliferation, differentiation, and migration.
In this study, cells were seeded onto a chitosan scaffold and an electrical current was run through the scaffold. The cells were then studied through DNA analysis to determine if there is improved cell proliferation or migration into the scaffold.
Methods: Chitosan that had been 85% deacetylized was dissolved in a 2% acetic acid to make a 2% (weight percent chitosan) solution. Twenty milliliters of this solution was then poured into a three millimeter casting jar and frozen. The frozen solution was then lyophilized until the scaffold is devoid of ice. The finished scaffold was then kept in the freezer until use.
A schematic of the experimental system is shown in Figure 5. A cylindrical tube was placed around the chitosan sample, the sample was sterilized with UV light,, and culture media was added to swell the sample to the size of the tube. The cells were then seeded onto the scaffold. An inner electrode was placed at the center of the sample, and an outer electrode was placed around the circumference.
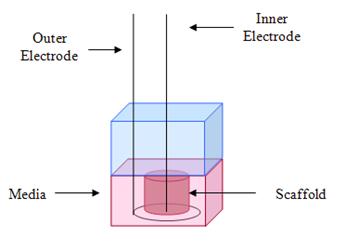
Figure 5: Scaffold and electrodes.
The treated scaffold was cut into three layers to distinguish between the top, middle, and bottom. Each of these layers was then cut into another three pieces (left, right, and center). All nine pieces were then tagged with pico green and examined under a fluorescence microscope. The number of cells in each image were counted and averaged.
Results: SEM images of the scaffold with and without current (Figure 6) demonstrate a 100 mm pore size, showing that the current did not visibly alter the scaffold. Similarly, elemental analysis did not indicate any difference in the chemical makeup of the two scaffolds.
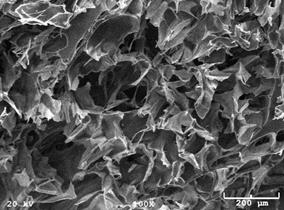
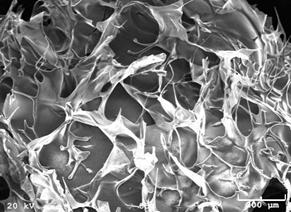
Figure 6: SEM images of the scaffold with (left) and without (right) current.
Fluorescent images of the cells within the middle layer for three cases, no current, positive outside/negative inside, and negative outside/positive inside, are shown in Figure 7. There were no apparent differences among the three conditions.
Figure 7: Cell images for no current (left), positive outside/negative inside (center) and negative outside/positive inside (right).
The average cell counts for each condition are shown in Figure 8. There is no clear difference among the different configurations or the different regions.
Figure 8: Average cell counts for each configuration.
Conclusions: A successful cell seeding protocol was developed that leads to an even distribution of cells throughout the scaffold. It was determined that an electric field of 2.67 V/cm does not affect cell migration, nor does it damage the cells or compromise the structure or composition of the scaffold. Finally, it was established that this strength of electric field can be used for scaffold modification without adverse effects.
Joseph Horvath, Harvey Tian and Mohamed Bashir: (Mentor – Steven A. Jones)
Title: The Effect of Shear Rate and L-Arginine on Platelet Adhesion
Blood platelet plays a key role in the formation of a thrombus. Pathological thrombus formations can cause heart attack and stroke. However, the biological pathways and their interaction with mechanical factors and mass transport are complicated. Of particular interest are the interactions among these factors and their integration into a combined positive-feedback/negative-feedback system that responds rapidly, yet is ultimately limited and controlled. Studies of these interactions require a system that can include hemodynamic features along with blood-borne agents and surfaces that include adhesion molecules. In our experiment we used a micro channel assembly which pushed platelets over a micro channel at constant flow rate. Fibrinogen, a protein that is responsible for aggregation of platelets was used as the surface molecule. The objective of the study was to determine the relative effects of L-arginine and adenosine diphosphate (ADP), when combined at different concentrations, on platelet adhesion.
Methods: Fibrinogen was coated onto the microchannels with layer by layer self assembly.
Whole blood was collected from bovines into enough sodium citrate to create a 9:1 blood:citrate ratio. The blood was then centrifuged at 320 rcf for 35 minutes, and the plasma layer was carefully extracted. A tris buffer solution is added to the plasma to bring the fluid level back to its original volume prior to the centrifuging. The platelet-rich plasma was then infused through the microchannels, after which the channels were stained with acridine orange and imaged under a fluorescent microscope. The images were analyzed with MATLAB program to give us the percent surface area coated by platelets. These experiments were performed with different concentrations of L-arginine (to inhibit platelet adhesion, i.e. negative feedback) and ATP (to stimulate platelet adhesion, i.e. positive feedback).
Results: The percent surface coverage as a function of L-arginine concentration is shown in Figure 9. Although there was a decrease in adhesion for higher concentrations, there was an initial increase, which is contrary to expectations.
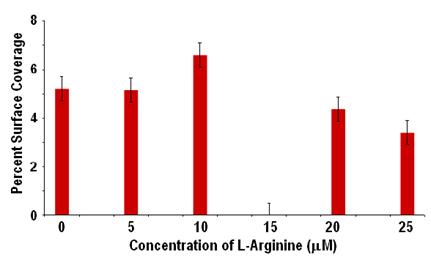
Figure 9: Adhesion to fibrinogen with different levels of L-arginine.
Discussion: The relatively tight standard deviations on the data points are encouraging, and indicate that repeatable results can be obtained. However, the trend did not follow expectations. Further examination of the channel that corresponded to 10 mM of L-arginine revealed that the inlet port had become partially obstructed by thrombus, which would cause increased shearing of the platelets and potentially increased activation and adhesion. This observation led to an additional investigation into the effect of inlet size on adhesion in the channels. However, there was not sufficient time to obtain definitive results from those studies.
Conclusions: Although the results were somewhat discouraging, a number of key observations were made during this study. The suggestions for future work are: (1) Separate plasma before removing the centrifuge tubes from the centrifuge (i.e. draw the plasma out with a syringe) to prevent remixing of the plasma with the red blood cell layer. (2) Do not over-tighten the microchannel device, as over-tightening can cause warping of the Plexiglass and lead to leakage from the channels. (3) The inlet holes on the microchanel device should be carefully checked before each experiment to ensure that they are not obstructed.
Elijah Champagne and Christian Jackson: (Mentor – Sven Eklund)
Title: Carboxyl-Functionalized Carbon Nanotubes for Electrodeposition on Platinum Surfaces
Introduction: Carbon nanotubes (CNTs) possesses excellent electron transfer rate, which is much better than conventional carbon electrodes, and they also allow surface chemistry between itself and foreign biomaterials such as enzymes. Functionalized nanotubes are typically easier to disperse in organic solvents and water, which can improve the dispersion and homogeneity of the MWCNTs within the electrolyte, thereby increasing the potential for electro-deposition of the functionalized MWCNTs. While electro-deposition based on carboxylated functionalized MWCNTs in a solution of glucose oxidase have been obtained and reported, results for carboxylated functionalized MWCNTs in solution by itself have yet to be reported. The preparation of carboxylic acid functionalized MWCNTs by two different approaches is described here. Both protocols are based on the chemical manipulation of carboxylic acid residues, easily and conveniently introduced onto the MWCNTs by chemical oxidation.
The first approach involves the use of heating to cause the acid to break down the MWCNTs facilitating the formation of carboxylic acid sites on the MWCNTs. The second approach involves the use of ultrasonication in concentrated acid to create carboxylic acid sites on the MWCNTs.
Two approaches are also used to recover the carboxylic acid functionalized MWCNTs. The first approach utilizes centrifugation to separate the carboxylic acid functionalized MWCNTs from the supernatant (sulfuric and nitric acids), leaving behind solid carboxylic acid functionalized MWCNTs. The second approach takes advantage of the benefit of 0.2 μm pore size polycarbonate filters where the carboxylic acid functionalized MWCNTs are recovered by creating a water-induced vacuum on the solution, filtering the supernatant and leaving the CNT residue behind.
Methods: Two batches of 0.2g of CNTs were first treated with a 3:1 mixture of sulfuric and nitric acid, respectively, and either sonicated for 4 hours or allowed to reflux overnight at 110 ℃. The carbon nanotube solution was then diluted in 400ml of de-ionized water and then either centrifuged in 10-15 min. time intervals or filtered using nucleopore polycarbonate filters (0.2μm), after which the functionalized CNTs were allowed to dry overnight in the oven at ~120℃. Redispersion of the CNTs in water was accomplished by adding 0.02 M NaOH until the pH was ~10, then subjecting the CNTs to sonication. The NaOH deprotonated the –COOH groups on the CNTs, imparting a negative charge (Eq. 1), thus allowing the CNTs to more easily disperse and remain in solution.
CNT – COOH + NaOH à CNT – COO− Na+ + H2O [Eq. 1]
To induce dispersion of the functionalized nanotubes to enhance the electrodeposition, the -COOH functionalized MWCNTs were mixed into a solution of water (15mg/ml) with 3-4 drops of 0.02 M NaOH and then sonicated for 1 hour. This process gave a fairly uniform dispersion of CNTs in solution. Electrochemistry was then commenced on the solution. During electrochemistry, the chemistry proceeds as follows:
In electrolyte:
Functionalized MWNT ↔ MWNT-COO- +H+
At anode:
MWNT-COO- + Ptanode ↔ MWNT-COO-Pt anode + e-
At cathode:
2H+ + 2e- ↔ H2gas
The electrochemistry was performed using a PAR 275 Galvanostat/Potentiostat. A Pt wire was used as the counter electrode, a Pt disc electrode was used as the working electrode, and an Ag/AgCl electrode was used as the reference electrode. Chronopotentiometry was used to maintain a constant current. Tests were normally run for one hour at a current between 1 and 100 μA. Following electrodeposition, both the Pt electrode and the Pt wire were rinsed with de-ionized water to remove any loosely adhering material.
An attempt to co-deposit CNTs with GOx was made by first making the CNT dispersion solution as above. To this solution was added 5 mg/mL glucose oxidase and the same chronopotentiomentry experimental conditions run as above.
The carboxylic functionalized MWCNTs were mixed into a solution of water (15mg/ml) and sonicated for 1 hour. 3-4 drops of 0.02 M NaOH was then added to the solution to induce dispersion of the functionalized nanotubes. The solution was then sonicated for another hour. Electrochemistry was then commenced on the solution. Pt wire was used as the counter electrode, a single quartz crystal electrode was used as the working electrode, and an Ag/AgCl electrode was used as the reference electrode. Chronopotentiometry was run for one hour at a current of 120μA. Following the experiment, the quartz crystal Pt electrode was rinsed with de-ionized water.
Results: Figure 10 shows a scanning electron microscope (SEM) image of MWCNTs functionalized with carboxylic acid groups on the surface of the quartz crystal electrode.
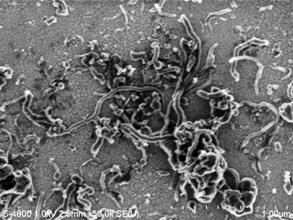
Figure 10: SEM image of a bundle of Carbon Nanotubes on the surface of the quartz crystal electrode
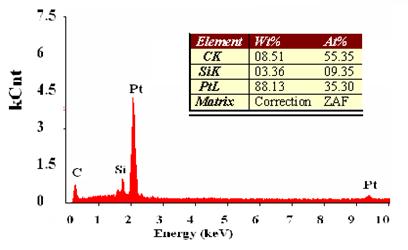
Figure 11 shows chronopotentiometry results, with the peaks separated into Pt, Si and C. With repeated trials, the atomic percent of carbon was greater than 50%, indicating that MWCNTs were on the surface of the quartz crystal.

Raman Spectroscopy was used to verify that the carboxylic acid functional groups were on the MWCNTs, but no peaks that identified with carboxylic acid groups. We also received the same results using Raman Spectroscopy with amide functionalized SWCNTs. (Future research is being proposed concerning amide/amine functionalized SW/MW CNTs). The functionalization of the MWCNTs with carboxylic acid groups is to be verified by attenuated total reflectance infrared (ATR-IR) in future research. No CNT films were visible on the Pt disc electrodes, but the wires showed what appeared to be a dark deposit, assumed to be CNTs, since that was the only material in solution
Discussion: While we were not able to run an SEM on the Pt wire, the fact that we could visually see the MWCNTs coating the surface of the Pt wire proves that carboxyl functionalized MWCNTs can be electrodeposited. This successful procedure of depositing carboxylic acid functionalized MWCNTs on a quartz crystal electrode in a solution of de-ionized water may simplify the process and lower the cost of developing a biosensor that can be used in a human environment. Although the results of these experiments varied widely, there appeared to have a normal deposit of CNTs on the working electrode wire, while the counter electrode showed what appeared to be a deposit of GOx (it should be noted that GOx has been previously electrodeposited under similar conditions). However, the apparent GOx deposit on the Pt electrode was unresponsive to additions of glucose when subjected to a chronoamperometry experiment with an applied potential of +0.6 V. In this test, if the GOx were active, the GOx in the presence of glucose (and oxygen) should produce hydrogen peroxide, which should then be seen as an oxidation current at the Pt electrode. No change in current was seen, so the results are inconclusive as to whether the deposit was GOx.
Conclusions: MWCNTs functionalized with carboxylic acid groups in an aqueous solution were deposited, both with and without glucose oxidase. However, the functionalized groups on the MWCNTs remain to be directly verified.
Summer 2009
Kineisha Green: (Mentor – David Mills)
Title: Cell Culture and Tissue Engineering the Temporomandibular Joint (TMJ) Disc
Introduction: The temporomandibular joint (TMJ) is a complex, sensitive, and highly mobile joint in the jaw. Millions of people in the United States suffer from temporomandibular disorders (TMD) which are painful and affect the ability to chew. The TMJ connects the mandible or lower jaw to the skull and regulates the movement of the jaw. It is a bi-condylar joint in which the condyles, located at the two ends of the mandible, function at the same time. The movable round upper end of the jaw is called the condyle and the socket is called the articular fossa. Between the condyle and the fossa is a disc made of fibrocartilage that acts as a cushion to absorb stress and allows the condyle to move easily when the mouth opens and closes. This study examined the feasibility of tissue engineering a temporomandibular disk.
Methods: Osteoblast cells were cultured onto a nanoscaffold that was electrospun from 9% PCL solution. A standard cell culture dish was used as the control. In one case the nanoscaffold was supplemented with collagen, and in another both collagen and growth factor were added. The DNA content of the cells was assayed with picogreen fluorescent dye.
Results: The picogreen results are shown in Figure 1. The control showed the least amount of DNA (related to cell proliferation) while the scaffold+collagen+growth factor had the highest amount of DNA.
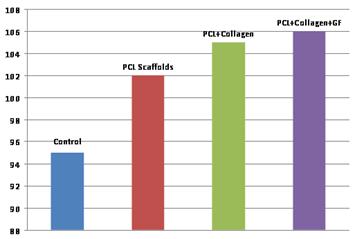
Figure 1: Picogreen assay on four substrates, which suggest that the PCL scaffold improves cell proliferation, while the addition of collagen and growth factor yielded additional improvement.
Conclusion: The results presented here are preliminary, but they suggest that the PCL scaffold favors cellular proliferation and may be a good substrate for osteoblast growth. Further tests are needed to examine the phenotype and protein expression of the cells.
David Hilgers: (Mentor – Sven Eklund)
Title: Calcium Biosensor
 Introduction: Calcium
is an important ion in multiple signaling mechanisms throughout the human body,
and consequently a wide variety of diseases are linked to irregularities in
calcium. A small, reliable and low-cost sensor that can easily measure calcium
concentrations would therefore be valuable for fundamental physiological
research. The immediate goal of the current research is to implement the basic
design as an oxygen sensor for later implementation as a calcium censor. The
proposed design is a fluorescent biosensor for measurement of extracellular calcium
concentration.
Introduction: Calcium
is an important ion in multiple signaling mechanisms throughout the human body,
and consequently a wide variety of diseases are linked to irregularities in
calcium. A small, reliable and low-cost sensor that can easily measure calcium
concentrations would therefore be valuable for fundamental physiological
research. The immediate goal of the current research is to implement the basic
design as an oxygen sensor for later implementation as a calcium censor. The
proposed design is a fluorescent biosensor for measurement of extracellular calcium
concentration.
Methods: A fiberoptic bundle, seen at the top of the device shown in Figure 2, sends light through the center fiber to a dye that fluoresces in response to the target agent, which is oxygen for this initial study. The dye is coated as a film on a well-cup. The fluorescent signal is collected by the six fiberoptic fibers that surround the transmitting fiber, and spectroscopy is used to detect the shift in the wavelength of light.
Results: To test the sensor, oxygenated distilled water was loaded into one flow channel, while deoxygenated water was loaded into another. The sensor was positioned to interrogate a common channel whose source alternated between the deoxygenated and oxygenated water channels. Figure 3 shows the response of the sensor to the alternating flow. The sensor output increased slowly in response to the deoxygenated water and decreased slowly in response to the oxygenated water. A similar, but weaker, response was found in response to cells that were alternately exposed to flow and no-flow conditions. These results indicate that the sensor functions, but that further work is needed to enhance signal-to-noise level and to improve response time.
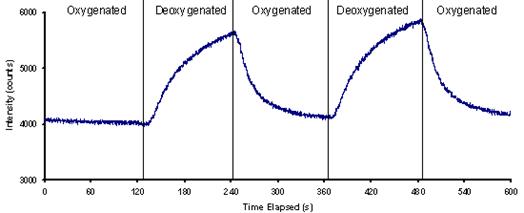
Figure 3: Response of the optical sensor to oxygenated and deoxygenated water.
Kenyon McAferty: (Mentor – Niel Crews)
Title: Sample Preparation Device for use in continuous flow PCR
 Introduction: DNA profiling requires
fast polymerase chain reaction (PCR) DNA analysis using the 13 different primer
sets established by the FBI’s combined DNA index system. Dr. Crews’ group is
developing a continous-flow PCR microdevice in which a sample moves through
zig-zag channels alternately through high and low temperature regions to
accomplish the heating and cooling necessary for PCR (Figure 4).
Continuous-flow PCR, particularly in conjunction with spatial DNA melting
analysis, provides fast testing of DNA samples using a single primer, but is
difficult to use with multiple primer sets. This work presents a sample
preparation device that can interface with a continuous-flow PCR device to
provide it with serial droplets of the same DNA sample wherein each droplet
contains a different set of PCR primers.
Introduction: DNA profiling requires
fast polymerase chain reaction (PCR) DNA analysis using the 13 different primer
sets established by the FBI’s combined DNA index system. Dr. Crews’ group is
developing a continous-flow PCR microdevice in which a sample moves through
zig-zag channels alternately through high and low temperature regions to
accomplish the heating and cooling necessary for PCR (Figure 4).
Continuous-flow PCR, particularly in conjunction with spatial DNA melting
analysis, provides fast testing of DNA samples using a single primer, but is
difficult to use with multiple primer sets. This work presents a sample
preparation device that can interface with a continuous-flow PCR device to
provide it with serial droplets of the same DNA sample wherein each droplet
contains a different set of PCR primers.
Methods: The design requirements to be examined were: (1) Ability of the input section to generate separate droplets of sample, (2) Ability of dried sample to provide correct amplification and (3) Ability of the input section to pump the sample into the PCR device.
The sample preparation device consists of an inlet for a mixture of the DNA sample and water, microfluidic channels to divide up the sample, wells containing pre-applied dehydrated primers, reagents, and catalysts necessary for PCR, novel "flat" microfluidic channels which function as valves, and a receiving channel with a continuous flow of oil that enters the PCR device and accepts each sample as it is expelled from the wells. To provide alternating droplets of the PCR sample, the aqueous sample was injected through a T-junction branch that had a flattened cross-section and oil was injected through a branch that had a square cross-section.
To test the ability of dried sample to support amplification, aPCR mixture of 1 part forward primer, 1 part reverse primer, 1 part dNTPs, 1 part Taq with bovine serum albumin (BSA), 1 part LC Green, 1 part buffer, 1 part DNA template (i.e. the sample), and 3 parts water was made. Combinations of these components were placed on PDMS and allowed to evaporate. The dried reagents were then further exposed to ionized air in the plasma cleaner and heat in the oven. Then the parts of the PCR mixture that had not been dried were placed on the dehydrated reagents. This mixture was allowed to sit for two minutes, and then it was inserted into a capillary and run through the Light Scanner 32. A positive and negative control made up at the same time as the sample were also run. This experiment was repeated for several combinations of parts of the mixture, but only the last experiment results will be reported.
The pumping action was tested for a configuration with an inlet channel, a well, and an outlet channel. Alternating pressure applied to the well activates the pumping.
 Results: Good droplet separation was
found for a T-junction with a 0.9 mm regular channel and a 0.525 mm flat
channel (Figure 5). The droplet lengths were approximately 2 mm.
Results: Good droplet separation was
found for a T-junction with a 0.9 mm regular channel and a 0.525 mm flat
channel (Figure 5). The droplet lengths were approximately 2 mm.
Fluorescent intensities confirmed amplification for the dried and undried samples (Figure 6). Some amplification was also found for the negative control, which is likely caused by some contamination of that sample.
The pumping tests confirmed that the input device was able to provide the needed flow input.
Conclusion: The concept developed for sample handling for continuous-flow PCR is feasible. Samples as small as 20 µL can be inserted into the well, although the issue of complete well filling must be addressed before the device will be functional, as incomplete filling introduces too many bubbles for the thermal gradient PCR to function properly. Reagents can be dried and stored in the well during the fabrication process and remain viable. They mix with the sample and can be pumped out of the well by simple mechanical force. The sample predictably enters the oil flow as a droplet and can be funneled into the PCR channel and achieve robust amplification.
Katherine Hudson: (Mentor – D. Patrick O’Neal)
Title: Analysis of a Gold Substrate Prototype Using Surface-Enhanced Raman Spectroscopy and Other Techniques
Introduction: In many microenvironments such as cell culture, small
changes in the concentration of certain substances can severely impact balance
of the environment. The ability to monitor these concentrations in real-time
would allow for better management of the microenvironments. Surface-enhanced
Raman spectroscopy (SERS) can register concentrations in the micro- to
nanomolar levels. Placing a reusable surface for SERS in the microenvironment to
measure concentrations of certain substances would fill this need for better
management.
The ability to rely on and reuse the GSP is the center of our ongoing research. Reusability hinges on the ability to remove the substance adsorbed onto the surface of the GSP so it can again measure concentrations without doing harm to the GSP. Two methods of obtaining reusability are looked at in this paper: heat modulated desorption and electrochemical desorption using cyclic voltammetry.
Methods: This paper looks at two separate ways to remove adsorbed substances from a gold substrate prototype (GSP) so that it can be reused to find real time concentrations down into the nanomolar range. The first way is to use heat to remove the material adsorbed on the surface of the GSP. The second way is to use cyclic voltammograms (CVs) to reverse the polarity of the GSP to repel or desorb the material. Both methods were confirmed using surface enhanced Raman spectroscopy (SERS). The material that was adsorbed onto the surface for heat tests was pMA and the material used for the CVs was malachite green (MG). In addition differences in the GSPs due to changes in the gold salt solution used to make them were qualified using SEM images and physical appearance.
Results: An important finding that was not part of the initial study was that the age of the gold salt solution has a direct effect on the physical properties of the GSPs. The solution that is used immediately after it is made creates GSPs that are orange-matted in color and seem to have colloid particles attached to its surface. If the solution is more than 24 hours old, however, the GSPs appear shiny and gold.
Heat was able to remove pMA from the surface of a GSP, and the signal returns when new pMA is applied. However, the severe decrease in intensity from almost 1800 counts to only 200 counts is problematic (Figure 7). To achieve reliable reusability the signal intensity cannot depend on the number of desorption cycles a GSP has gone through. Either all the GSPs must go through an initial desorption to bring the signal intensity down to 200 counts or new substrates must be used each time. Also, after only 4 cycles in the heat (225°C) the GSPs became so brittle that they snapped into many pieces even when handled lightly by tweezers. 4 mediocre uses of a GSP do not qualify as quality reusability.
Desorption through electrochemistry could not be accomplished because the GSP was not sufficiently conductive. Enhancement factor calculations showed that the GSP is an effective SERS active surface.
Conclusion: Overall the GSP is an effective and reliable way to measure SERS spectra. The GSPs give significant enhancement and can be reused to a certain extent. With more research into electrochemistry their reusability may increase and allow the GSPs to be used in microenvironments to monitor real-time concentrations of several substances important to the growth or balance of organisms living in the microenvironment.
Andrew Paille: (Mentor – Sidney Sit)
Title: Drug Release of FITC-loaded Hydrogel in Macro Patterned and Micro Patterned Arrangements
Introduction: Successful treatment of disease depends on constant administration of drugs to an affected area of the body. Researchers have examined the use of biocompatible molecular “nets” that trap the drug and adhere to the affected site, where the drug is released. The drug is thus released only in the targeted area and does not cause adverse effects at other locations.
Polyethylene Glycol (PEG) is a biocompatible polymeric hydrogel that can be used to contain various drugs. An array of drug-loaded hydrogel spots can be applied to the surface of the human skin and release the drug transdermally. However, little is known about how the patterning of the hydrogel material effects drug absorption into the body. The more contact surface area to volume ratio, the faster and more efficiently the drug should absorb into contact fluid. So this experiment will use different hydrogel printing techniques to alter the surface area to volume ratio, or size, of spherical hydrogel spots.
Macrospots and microspots will be examined. The macrospots, with an average spot diameter of 0.2 centimeters, will be printed on a surface using a hydrogel filled micropipette. The microspots, with an average diameter of about 12 microns, will be printed with a microspot printing device called a NanoEnabler.
It is hypothesized that because the surface area to volume ratio of the microspots is much greater than that of the macrospots, the drug will be released much more quickly than in the latter. Also, it is hypothesized that the percentage of drug release from the microspots will be higher because of their small size; not as much drug will remain trapped inside of the spot.
Methods: Standard 3x1 in. glass slides were cleaned with methanol, ethanol, and chloroform for seven minute intervals each. Twenty milliliters of chloroform were then mixed with one milliliter of octadecyltrichlorosilane. Slides are immersed in this mixture for thirty minutes and then rinsed with pure chloroform. The silane compound chemically modifies the surface of the slide and makes it hydrophobic. The solution to be patterned was a mixture of 0.6 ml of PEG-DA stock solution with 0.134 ml of FITC stock solution. Three of the slides were pattered with a size 20 RAININ micropipette. Each spot volume was 0.002 (Figure 8).
Figure 8: Left: macropatterned slide. Right: Micropatterned surface (viewed through the NanoEnabler software interface).
The patterned slides were then placed in Petri dish and covered with 1.5 ml of 1X PBS solution. The solution was removed and replaced after 30, 60, 90, 120, 180, 300, 420, 540, and 1440 minutes. The fluorescent intensity of the removed solution was then measured and translated to drug concentration with the aid of a standard curve.
Results: Figure 9 shows the release of the FITC for the macro and microspot patterning. The rate of drug release and the total amount of drug released after 24 hours were both greater for the microspotted slide. However, because the tip of the NanoEnabler is only 30 micrometers in diameter, any small obstruction can clot the tip and reduce the flow of hydrogel. FITC Dextran and FITC BSA drugs were both used and if they were present in concentrations greater than 12.5 mg/ml, the microspot size was limited to approximately 7 microns on average. To get larger spot sizes, pure FITC dye was used in these experiments. Since the FITC dye has a lower molecular weight than the FITC Dextran or BSA, 12 microns diameter spots could be patterned.
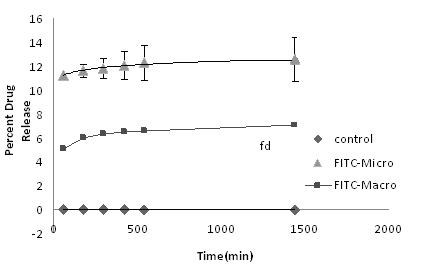
Figure 9: Drug release over time for the micro and macro patterning.
Conclusions: The results support the hypothesis that decreased spot sizes lead to larger ratios of surface area to volume and therefore to greater drug release .
Andrew Veverka: (Mentor – Steven A. Jones)
Title: Behavior of Platelets in Dynamic and Static Conditions
Introduction: Stroke and Heart attack are caused by arterial thrombi, which in turn depend on platelet activation, adhesion and aggregation. Platelets secrete agents that act as platelet activators, and they also secrete platelet inhibitors. We propose that the motion of blood and associated mass transport phenomena affect the relative importance of activators and inhibitors. The initial objectives of this set of experiments are to determine whether platelet adhesion is enhanced or decreased when the fluid in contact with a glass slide is agitated.
Methods: Citrated bovine whole
blood was centrifuged at 320 rcf for 35 minutes to extract the platelet-rich
plasma. Layer-by-layer self assembly was used to coat the glass slides, which
were  then exposed to the plasma
in a Petri dish. For each experiment, one slide was static and the other was
agitated by a vortexer to which a metal plate had been attached (Figure 10). A
student T-test was used to determine the statistical differences between the adhesion
for the agitated and unagitated condition. The slides were then stained with
acridine orange, rinsed, and then imaged by fluorescent microscopy. The images
were analyzed with MATLAB program to give us the percent surface area coated by
platelets. The null hypothesis is that there is no difference and both the
stationary and the agitated samples will give the same mean. The alternative
hypothesis is that the agitated sample will have a higher average surface
coverage. A p-value of 0.05 was considered significant.
then exposed to the plasma
in a Petri dish. For each experiment, one slide was static and the other was
agitated by a vortexer to which a metal plate had been attached (Figure 10). A
student T-test was used to determine the statistical differences between the adhesion
for the agitated and unagitated condition. The slides were then stained with
acridine orange, rinsed, and then imaged by fluorescent microscopy. The images
were analyzed with MATLAB program to give us the percent surface area coated by
platelets. The null hypothesis is that there is no difference and both the
stationary and the agitated samples will give the same mean. The alternative
hypothesis is that the agitated sample will have a higher average surface
coverage. A p-value of 0.05 was considered significant.
Results: Figure 10 shows a typical set of data for the static and dynamic conditions when the slide was coated with one bilayer. Although this figure suggests a larger amount of adhesion for the static case, other slides showed the opposite result, so the final results were not statistically significant at the 0.05 level.
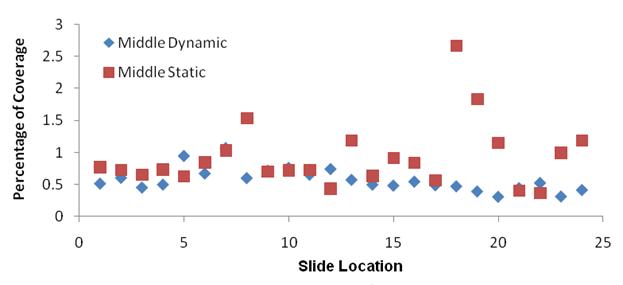
Figure 10: Percentage of surface coverage on a glass slide with one bilayer of fibrinogen under static and dynamic conditions.
Additional experiments were performed with 3 and 5 bilayers. The adhesion results are summarized in Figure 11. As the number of bilayers increased, the adhesion in the dynamic case tended to be greater than the adhesion in the static case. However, none of the cases indicated statistical significance at the 0.05 level.
 Conclusion:
Although the results were not statistically significant, they suggest that significance
can be shown with a larger data set. Furthermore, the results indicate that
the adhesion will depend on the number of bilayers in the layer-by-layer
process. Whether or not significance is shown, the next step will involve the
addition of L-arginine to the platelet-rich plasma to stimulate the production
of platelet-derived nitric oxide. Because nitric oxide is small and has a high
diffusion coefficient, it is proposed that its transport will be particularly
important to the inhibition of platelet adhesion.
Conclusion:
Although the results were not statistically significant, they suggest that significance
can be shown with a larger data set. Furthermore, the results indicate that
the adhesion will depend on the number of bilayers in the layer-by-layer
process. Whether or not significance is shown, the next step will involve the
addition of L-arginine to the platelet-rich plasma to stimulate the production
of platelet-derived nitric oxide. Because nitric oxide is small and has a high
diffusion coefficient, it is proposed that its transport will be particularly
important to the inhibition of platelet adhesion.
Jue “Joy” Wang: (Mentor – Long Que)
Title: Optical biosensing with a polymer-based micromachined Fabry-Perot interferometer
Introduction: Numerous optical devices, such as gratings, mirrors, lenses, and interferometers have been miniaturized and modified to sense on the micro level. The micromachined Fabry-Perot interferometer (μFPI), an especially versatile optical sensor, can be used for gas sensing, chemical sensing, and optical modulation. The interferometer’s center cavity contains the gases and chemicals and a spectrometer detects the effect of the chemical or gas on the light. The μFPI includes a crosslinked electro-optic polymer in its cavity, which allows for high time bandwidth modulation.
A Fabry-Perot interferometer is usually used to control and measure wavelengths of light through shining a beam between two highly reflecting parallel plates. The beam goes through multiple reflections where some of the beam gets transmitted and some of the beams get reflected. If all of the reflected beams are in phase, then constructive interference takes place and transmission peaks occur. The narrower the transmission peaks, the higher the reflectivity and the easier it becomes to detect slight phase shifts between different chemicals through the different indexes of refraction. In this project, the ultimate goal is a high-performing refractive index sensor that can be used on the microscopic level.
Traditionally, m-FPIs have been fabricated from silicon, polysilicon, silicon nitride, or silicon oxide, which are all semiconductive materials based from the element silicon. Past μFPIs have also operated on laser sources. However, such interferometers are expensive and cannot allow for one-use disposals, despite risks for cross-contamination upon reuse. Therefore, a new μFPI design has been proposed, which contains a polymer base using polydimethylsiloxane and is operated by a white-light source. Polydimethylsiloxane (PDMS for short) is a silicon-based organic polymer, a common plastic material. Unlike the traditional fabrication approach, which requires several mask-leveling processes and a laser source, this new design will make fabrication less expensive, and require only a white light source.
A primary goal of this project is to monitor real-time bonding of antibodies and antigens and detect the phase shifts before and after the bonding due to differences in the refractive indexes. The long-term objective of the project is to utilize this ability in field of drug discovery and screening.
Methods: The light source undergoes multiple reflections inside a cavity formed by a PDMS layer and a gold-coated plate. Antibodies (BSA) are immobilized onto the gold surface. Then a the liquid containing antigens or protein is injected into the Fabry-Perot interferometer cavity with a KD Scientific syringe pump and allowed to interact and bond with the antibodies on the gold surface. After bonding, the liquid is flushed from the cavity to remove the excess unbounded antigens. The reflected signals, represented as intensity as a function of time, are recorded at each stage of this process.
Results: Differences in sample content are indicated by phase shifts in the intensity signal from the interferometer. Although there is some noise in these signals, the do show such phase shifts between the samples corresponding to the bare cavity, the antigen and the antigen+antibody combination (Figure 12).
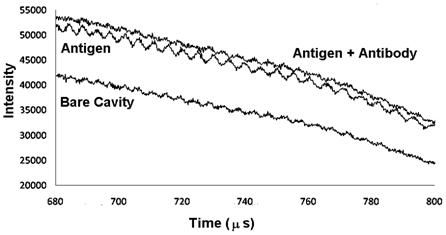
Figure 12: Intensity output of the interferometer for the three conditions tested.
Conclusions: The interferometer provided signals that could distinguish between different cases. However the signals are still noisy, and it was often difficult to remove unwanted bubbles from the cavity. The fringe shapes also depended strongly on the pressure at the input tube. It will be necessary to solve this problem before the device will be practical.
Louis Reis: (Mentor – Eric Guilbeau)
Title: Immobilization of Glucose Oxidase for Temperature-Based Analysis Using Layer-by-Layer Assembly
Introduction: Thermopiles are highly sensitive instruments for the detection of temperature, and they can be used, in particular, to detect changes in temperature with high sensitivity. Therefore, the detection of endothermic or ectothermic reactions can be used as a basis for chemical analysis in a wide variety of sensors. In such sensors, reactants or catalysist can be immobilized on microchannels that pass over the thermopile, and the reactions that occur as the analyte flows through the region are indicated by a change in the thermopile voltage output. One type of sensor that is particularly important is the glucose sensor. In this project, we use layer-by-layer self assembly to immobilize glucose on a thermopile system.
Methods: Glucose oxidase oxidizes glucose to gluconic acid, while releasing 80 kJ/mole. A (negatively charged) glass substrate was used, and was first coated with a positive layer of PEI. Two bilayers of alternating PSS and PEI were then added, and a final set of alternating Glucose oxidase and PEI layers formed the surface (Figure 13). Atomic force microscopy was used to analyze the layered surfaces and determine layer thickness.

Figure 13: Layering pattern for glucose oxidase immobilization.
Results: Figure 14 shows the atomic force microscopy images for the clean slide, the PEI/PSS precursor layer and the completed assembly with glucose oxidase. The glucose oxidase has more small-scale features than the PEI/PSS precursor layer. It also indicates that there is some grouping of the layering, as suggested by the peaks in the image. The thickness of the PEI/PSS layer was 10 to 15 nm, and the thickness of the glucose oxidase layer was 35 to 45 nm.
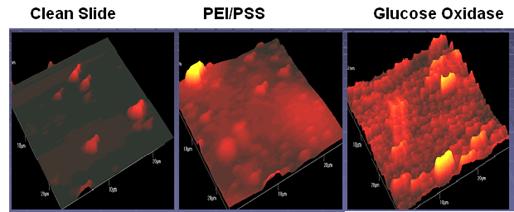
Figure 14: Atomic force microscopy images for the clean slide, the PEI/PSS precursor layer and the completed assembly with glucose oxidase.
Conclusion: Layer-by-layer assembly is an effective method to immobilize glucose oxidase onto the substrate.